| General Discussion Undecided where to post - do it here. |
| Reply to Thread New Thread |
|
|
|
|
#1 |
|
|
My boss, coworkers, and myself are puzzled about this. I have to compare sales for 2 types of products over a specific time period. The problem is that these products are scattered throughout these years. Some existed only 2-3 years in the middle of the required time frame (others in the beginning or end). Others existed for much longer. Year to year sales differences are also great. Usually sales per year increase with years, but some increases are huge (from 30 million to 700 million in just one year). So, how could I fairly compare sales from these 2 types of products.
|
|
|
|
|
#2 |
|
|
|
|
|
|
|
#3 |
|
|
You would have to take into account where the Product is in its lifecycle. From there if you make the necessary adjustment for "seasonality" (statistical seasonality not climate) across the life cycle stages it should give you a rough estimate of general sales for those products over your time period.
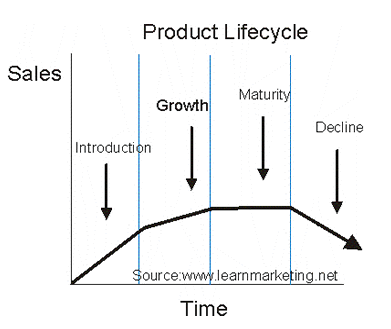
Product Life Cycle Curve:  That 30 -> 700 increase would be the growth stage. Seasonality To account for seasonality, you need to apply statistical decomposition. Mind you this is generally used in Demand forecasting, should help in this situation. Seasonal Factors = (Avg. For the same period) / (Overall Avg. Sales per period) e.g. S.F. = (Y1Q1 + Y2Q1 + Y3Q1 .... YnQ1) / (Overall Avg Sales per period) Demand (sales in your case) = Actual Sales / Season Factors You would use the calculated "sales" in this case because it should (in theory) take into account the stages in product life cycle. This would even out the overall sales trends per product and allow for a better comparison of sales between the different products. Remember, this is not by any means perfect. Depending on your products you have to think of any events that occurred that could have caused a spike increase or decrease in your sales. (e.g. A fire occurs and a bunch of local stores apply for extra insurance. Or a tornado rips a town asunder and building material sales go through the roof.) These spikes should be discounted as statistical outliers and ignored for most purposes. |
|
|
|
|
#4 |
|
|
You would have to take into account where the Product is in its lifecycle. From there if you make the necessary adjustment for "seasonality" (statistical seasonality not climate) across the life cycle stages it should give you a rough estimate of general sales for those products over your time period. So, in this case seasons would be parts of the product life cycle. However, this is pharmaceutical and biotechnology industry. Products don't get kicked off the market during their decline all the time. Often its FDA withdrawing them and the cycle would end at any stage. This is up to me to figure out the rest! Thanks again! |
|
|
| Reply to Thread New Thread |
«
Previous Thread
|
Next Thread
»
| Currently Active Users Viewing This Thread: 1 (0 members and 1 guests) | |
|
|


 Hybrid Mode

