| Reply to Thread New Thread |
|
|
 07-28-2012, 07:43 PM
|
#1 |
|
|
A paper published today in Geophysical Research Letters finds that sea surface temperatures [SSTs] in the Southern Okinawa Trough off the coast of China were warmer than the present during the Minoan Warm Period 2700 years ago, the Roman Warm Period 2000 years ago, and the Sui-Tang dynasty Warm Period 1400 years ago. According to the authors, "Despite an increase since 1850 AD, the mean [sea surface temperature] in the 20th century is still within the range of natural variability during the past 2700 years."
In addition, the paper shows the rate of warming in the Minoan, Roman, Medieval, and Sui-Tang dynasty warm periods was much faster than in the current warming period since the Little Ice Age. The paper finds "A close correlation of SST in Southern Okinawa Trough with air temperature in East China, intensity of East Asian monsoon and the El-Niño Southern Oscillation index has been attributed to the fluctuations in solar output and oceanic-atmospheric circulation 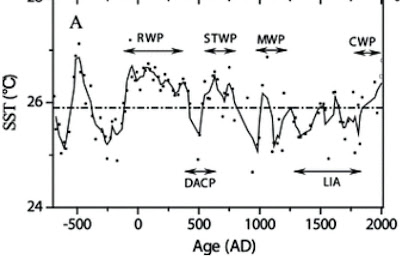 econstructed Sea Surface Temperatures [SSTs] over the past 2700 years. The Minoan, Roman {RWP], & Sui-Tang dynasty [STWP] warm periods were all warmer than the current warm period [CWP]. The Dark Ages Cold Period [DACP] and Little Ice Age [LIA] are also shown Geophysical Research Letters Sea surface temperature variability in southern Okinawa Trough during last 2700 years Weichao Wu, Wenbing Tan, Liping Zhou, Huan Yang, Yunping Xu http://www.agu.org/pubs/crossref/201...GL052749.shtml Most of the temperature reconstructions for the past two millennia are based on proxy data from various sites on land. Here we present a bidecadal resolution record of sea surface temperature (SST) in Southern Okinawa Trough for the past ca. 2700 years by analyzing tetraether lipids of planktonic archaea in the ODP Hole 1202B, a site under the strong influence of Kuroshio Current and East Asian monsoon. The reconstructed SST anomalies generally coincided with previously reported late Holocene climate events, including the Roman Warm Period, Sui-Tang dynasty Warm Period, Medieval Warm Period, Current Warm Period, Dark Age Cold Period and Little Ice Age. However, the Medieval Warm Period usually thought to be a historical analogue for the Current Warm Period has a mean SST of 0.6–0.8°C lower than that of the Roman Warm Period and Sui-Tang dynasty Warm Period. Despite an increase since 1850 AD, the mean SST in the 20th century is still within the range of natural variability during the past 2700 years. A close correlation of SST in Southern Okinawa Trough with air temperature in East China, intensity of East Asian monsoon and the El-Niño Southern Oscillation index has been attributed to the fluctuations insolar output and oceanic-atmospheric circulation. |

|


|
07-30-2012, 02:47 AM
|
#2 |
|
|
Yeah, well we all know that you are a big time Climate Change Denier, so while this appears to run contrary to the accepted trends, this will all probably all be explained in the next IPCC report.
And it is probably just a one-off and I'll bet that there aren't any other examples of proxies that display this trend. Nothing from Australia I'll bet. And I'll bet this doesn't agree with any of the well established and accepted climate models. |
|
|
|
07-30-2012, 03:39 AM
|
#3 |
|
|
> Here we present a bidecadal resolution record of sea surface temperature (SST) in Southern Okinawa Trough for the past ca. 2700 years by analyzing tetraether lipids of planktonic archaea
I was wondering how the heck you could measure the sea surface temperature before oceanic records from ships. This will work, but just be aware that changes in lipid make-up of can occur through a range of different mechanisms. Think of it as a measure of "stress" in these organisms. Stress can be due to temperature variations, which affect sea surface dissolved gasses, but can also be due to other things. These methods need to be very carefully calibrated and even then the conclusions can't always be relied upon. |
|
|
|
07-30-2012, 03:42 AM
|
#4 |
|
|
|
|
|

|
07-30-2012, 03:46 AM
|
#5 |
|
|
If you can't establish what is normal from the past, it is difficult to make claims about the present, let alone predictions about the future.
|
|
|
|
07-30-2012, 04:16 PM
|
#6 |
|
|
If you can't establish what is normal from the past, it is difficult to make claims about the present, let alone predictions about the future. |
|
|
|
07-30-2012, 05:10 PM
|
#7 |
|
|
I thought that this was going to be a thread about resilient paper...
|
|
|
|
07-30-2012, 06:41 PM
|
#8 |
|
|
Ouch just read an article in SMH about a converted sceptic
http://www.smh.com.au/environment/cl...730-23769.html |
|
|
|
07-30-2012, 06:56 PM
|
#9 |
|
|
I thought that this was going to be a thread about resilient paper... |
|
|
|
07-30-2012, 10:58 PM
|
#10 |
|
|
Ouch just read an article in SMH about a converted sceptic
http://www.smh.com.au/environment/cl...730-23769.html Ouch ? You wish. Besides the overwhelming transition of viewpoints going from alarmist to sceptical, what has Muller to say? In your link Muller states in the New York Times Im now going a step further: Humans are almost entirely the cause. But Richard Muller, December 17, 2003 said _ In most fields of science, researchers who express the most self-doubt and who understate their conclusions are the ones that are most respected. Scientists regard with disdain those who play their conclusions to the press. Ouch. Seems somewhat hypocritical. But how far from the sceptics argument (uncertainty) has Muller moved? Also from Mullers Op-Ed in the NYT ''While this doesn't prove (his temp reconstruction) that global warming is caused by human greenhouse gases Thanks for admitting that Muller. Also - Its a scientists duty to be properly skeptical. I still find that much, if not most, of what is attributed to climate change is speculative, exaggerated or just plain wrong. Ive analyzed some of the most alarmist claims, and my skepticism about them hasnt changed. Hurricane Katrina cannot be attributed to global warming. The number of hurricanes hitting the United States has been going down, not up; likewise for intense tornadoes. Polar bears arent dying from receding ice, and the Himalayan glaciers arent going to melt by 2035. And its possible that we are currently no warmer than we were a thousand years ago, during the Medieval Warm Period or Medieval Optimum, an interval of warm conditions known from historical records and indirect evidence like tree rings. And the recent warm spell in the United States happens to be more than offset by cooling elsewhere in the world, so its link to global warming is weaker than tenuous. |
|
|
|
07-30-2012, 10:58 PM
|
#11 |
|
|
Comment, Judith Currie on Muller's 'BEST'
With regards to the new paper, I strongly disagree with their interpretation of attribution. The scientific analyses that the BEST team has done with the new data set are controversial, including the impact of station quality on interpreting temperature trends and the urban heat island effect. Their latest paper on the 250 year record concludes that the best explanation for the observed warming is greenhouse gas emissions. In my opinion, their analysis is way over simplistic and not at all convincing. There is broad agreement that greenhouse gas emissions have contributed to the warming in the latter half of the 20th century; the big question is how much of this warming can be attributed to greenhouse gas emissions. I don’t think this question can be answered by the simple curve fitting used in this paper, and I don’t see that their paper adds anything to our understanding of the causes of the recent warming. |
|
|
|
07-30-2012, 10:58 PM
|
#12 |
|
|
But Muller’s efforts in his temp reconstruction are best summed up by Pielk Snr.
http://pielkeclimatesci.wordpress.co...e-trends-by-w/ within his comments on a new paper - An area and distance weighted analysis of the impacts of station exposure on the U.S. Historical Climatology Network temperatures and temperature trends . - press release - http://wattsupwiththat.com/2012/07/2...-2/#more-68286 “In direct contradiction to Richard Muller’s BEST study, the new Watts et al 2012 paper has very effectively shown that a substantive warm bias exists even in the mean temperature trends. This type of bias certainly exists throughout the Global Historical Climate Network, as well as what Anthony has documented for the US Historical Climate Reference Network. Anthony’s new results also undermine the latest claims by Richard Muller of BEST, as not only is Muller extracting data from mostly the same geographic areas as for the NCDC, GISS and CRU analyses, but he is accepting an older assessment of station siting quality as it affects the trends. Indeed, since he accepted the Fall et al 2011 study in reporting his latest findings, he now needs to retrench and re-compute his trends. Of course, for the non-USHCN sites, he must bin those sites as performed by Anthony’s research group. If he does not, his study should be relegated to a footnote of a out-of-date analysis. In Richard Muller’s Op-Ed in the New York Times (see The Conversion of a Climate-Change Skeptic), he makes far-reaching conclusions based on his sparse knowledge of the uncertainties in multi-decadal land surface temperature record. His comments show what occurs when a scientist, with excellent research credentials within their area of scientific expertise, go outside of their area of knowledge. His latest BEST claims are, in my view, an embarrassment. The statement that he makes in his op-ed are easily refuted. It certainly appears that Richard Muller is an attention-getter, which he has succeeded at, but, unfortunately, he has demonstrated a remarkable lack of knowledge concerning the uncertainties in quantifying the actual long-term surface temperature trend, as well as a seriously incomplete knowledge of the climate system. |
|
|
|
07-30-2012, 10:59 PM
|
#13 |
|
|
http://wattsupwiththat.com/2012/07/2...-2/#more-68286
An area and distance weighted analysis of the impacts of station exposure on the U.S. Historical Climatology Network temperatures and temperature trends A.Watts, E. Jones, S. McIntyre, Dr. J. R. Christy A reanalysis of U.S. surface station temperatures has been performed using the recently WMO-approved Siting Classification System devised by METEO-France’s Michel Leroy. The new siting classification more accurately characterizes the quality of the location in terms of monitoring long-term spatially representative surface temperature trends. The new analysis demonstrates that reported 1979-2008 U.S. temperature trends are spuriously doubled, with 92% of that over-estimation resulting from erroneous NOAA adjustments of well-sited stations upward. The paper is the first to use the updated siting system which addresses USHCN siting issues and data adjustments. The new improved assessment, for the years 1979 to 2008, yields a trend of +0.155C per decade from the high quality sites, a +0.248 C per decade trend for poorly sited locations, and a trend of +0.309 C per decade after NOAA adjusts the data. This issue of station siting quality is expected to be an issue with respect to the monitoring of land surface temperature throughout the Global Historical Climate Network and in the BEST network. http://wattsupwiththat.com/2012/07/2...-2/#more-68286 |
|
|
|
07-30-2012, 11:00 PM
|
#14 |
|
|
|
|
|
|
07-30-2012, 11:09 PM
|
#15 |
|
|
Someones had a meltdown
Not at all. just responding to your off topic, weak effort response |
|
|
|
07-30-2012, 11:11 PM
|
#16 |
|
|
Besides the overwhelming transition of viewpoints going from alarmist to sceptical I can't think of a single person who calls themself a "sceptic" who is both sceptical about evidence supporting their position and non-alarmist about the effects of measures to reduce GHG emissions, but if you can supply some names, together with evidence of their scepticism and non-alarmism, I'd be interested to see it.
|
|
|
|
07-30-2012, 11:12 PM
|
#17 |
|
|
"just responding to your off topic, weak effort response"
although your effort wasn't quite as bad as that of Kingys. That was shit. |
|
|
|
07-30-2012, 11:14 PM
|
#18 |
|
|
Comment, Judith Currie on Muller's 'BEST' It is also a strong argument for adopting a cautious approach to the regulation of industrial processes that may affect the climate. |
|
|
|
07-30-2012, 11:25 PM
|
#19 |
|
|
Amusing how you lot take the word skeptic and apply it to people who in less kind times would be described as flaming nongs.
|
|
|
|
07-30-2012, 11:27 PM
|
#20 |
|
|
It is also a strong argument for adopting a cautious approach to the regulation of industrial processes that may affect the climate.
what like, climate stabilisation? http://sciencepolicy.colorado.edu/ad...05-2009.58.pdf A B S T R A C T The goals and objectives of ‘climate stabilization’ feature heavily in contemporary environmental policy and in this paper we trace the factors that have contributed to the rise of this concept and the scientific ideas behind it. In particular, we explore how the stabilization-based discourse has become dominant through developments in climate science, environmental economics and policymaking. That this discourse is tethered to contemporary policy proposals is unsurprising; but that it has remained relatively free of critical scrutiny can be associated with fears of unsettling often-tenuous political processes taking place at multiple scales. Nonetheless, we posit that the fundamental premises behind stabilization targets are badly matched to the actual problem of the intergenerational management of climate change, scientifically and politically, and destined to fail. This report thereby feeds into and perpetuates a particular approach to long-term climate targets and, additionally, has continued to privilege discussions of long-term mitigation over adaptation. Reaching coordinated solutions to climate change becomes a question of mitigating and managing the long-term future in a very specific, highly abstract way, since it involves future generations emitting just enough CO2 to maintain the concentrations at their target levels indefinitely regardless of the implications of this strategy for them and their descendents. The reliance on equilibrium targets simplifies certain parts of the problem by removing the (inconvenient) transience, allowing us to draw a simple map between concentration and sensitivity that does not depend on the thermal inertia of the system. However, the equilibrium system properties (such as climate sensitivity) are subject to considerable uncertainty, and thus the translation from damages (temperature increase) to concentration targets is also subject to uncertainty. Even if we assume that climate sensitivity is in the vicinity of the IPCC’s estimate(s), we would need to stabilize concentrations anywhere in the vicinity of 700–330 ppmv CO2 (and this range neglects the additional uncertainty that might be produced from equilibrium temperature–carbon cycle feedbacks). |
|
|
| Reply to Thread New Thread |
«
Previous Thread
|
Next Thread
»

 Hybrid Mode
| Currently Active Users Viewing This Thread: 1 (0 members and 1 guests) | |
|
|

